The City That Assumed It Was Safe
Hobart has long occupied a comfortable position in the Australian climate imagination: cool, temperate, and insulated from the extreme heat that defines summers in Melbourne, Adelaide, and Sydney. That assumption is now being tested by data. A January 2026 report commissioned by the City of Hobart found that nearly a quarter of all homes in the city fall within the highest heat-risk categories, with suburbs such as New Town, Sandy Bay, and Lenah Valley identified as most susceptible to rising temperatures.
The report, produced by Geoneon, used land-surface temperatures alongside residential demographics to map heat vulnerability at a suburban scale. Its findings challenge the idea that heat is a problem for the mainland north. Hobart’s heat risk is real, unevenly distributed, and projected to intensify.
The Health Data Behind the Warning
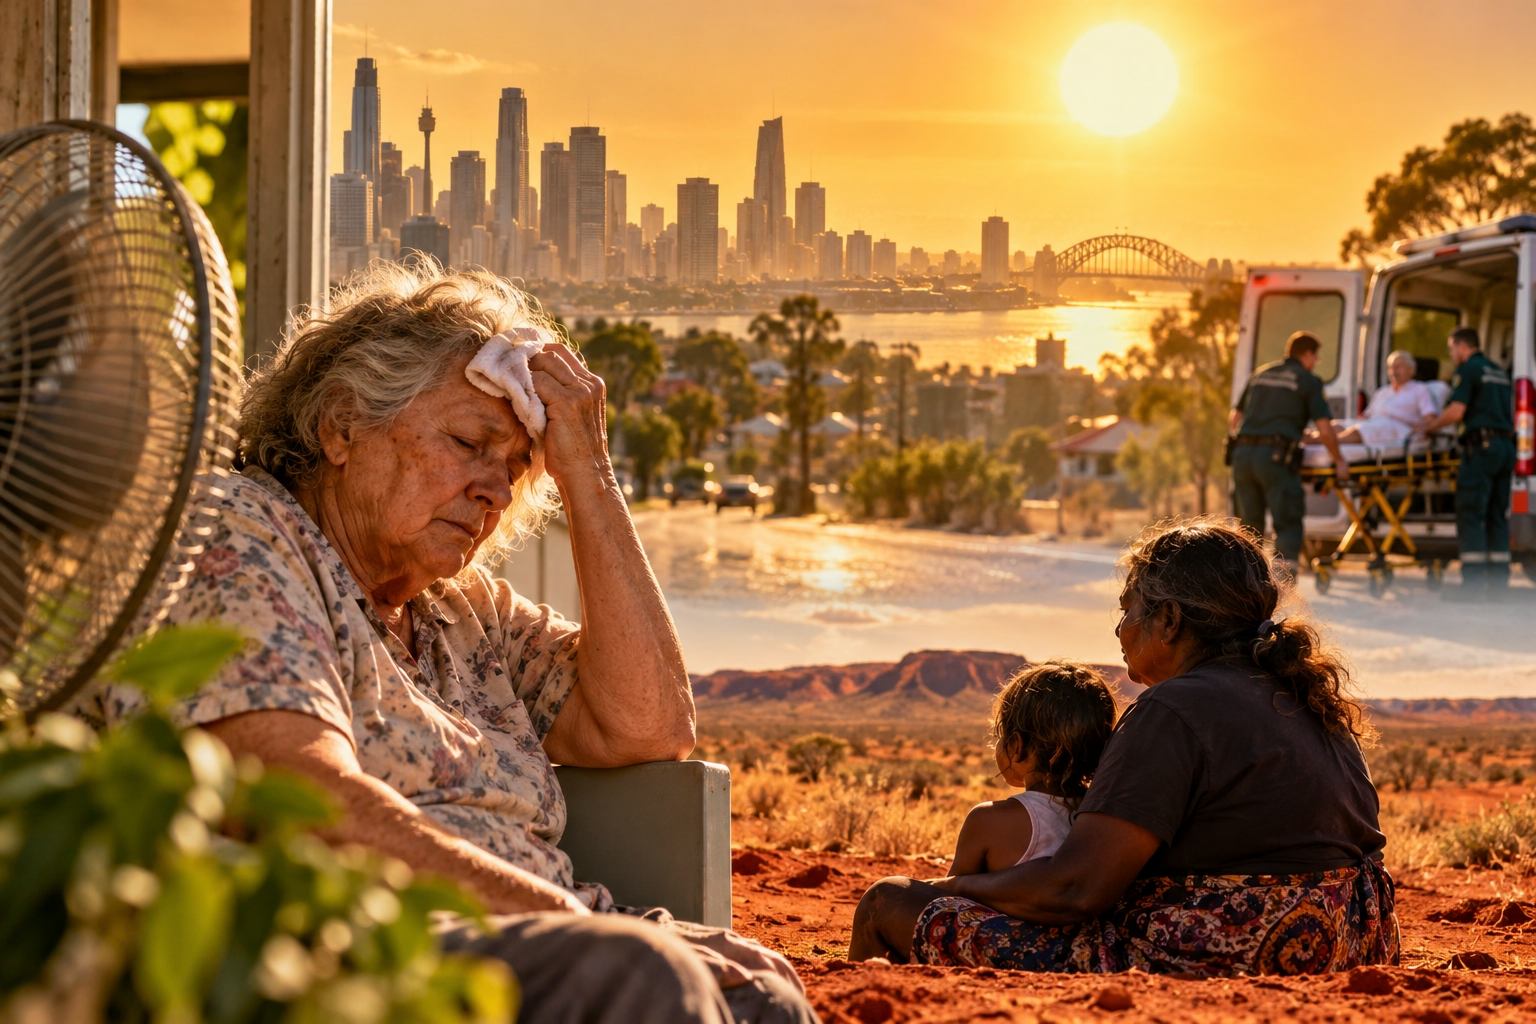
The clinical evidence supports the local mapping. Data from the Menzies Institute for Medical Research at the University of Tasmania shows that statewide there is a 6% increase in ambulance dispatches and a 5% increase in emergency department presentations during heatwaves. University of Tasmania research also found an 8% increase in mortality during heatwaves.
An 8% mortality increase in a state not historically associated with extreme heat is a significant finding. It suggests that populations acclimatised to cooler conditions may be physiologically and behaviourally less prepared for heat events. Homes designed to retain warmth in winter can become heat traps in summer. Residents who have never needed to think about heatstroke may not recognise its early symptoms. And local health systems calibrated for cold-weather demand may lack surge plans for heat-related presentations.
The Urban Heat Island Comes to Tasmania
Some Hobart suburbs run 1–7°C hotter than surrounding areas due to the urban heat island effect, where roads, roofs, and concrete retain and amplify heat. This is not a marginal variation. A seven-degree difference between a leafy suburb and a dense, low-canopy neighbourhood can determine whether an elderly resident experiences manageable warmth or dangerous heat stress.
Under current climate projections, Hobart averages seven days per year above 30°C. By 2050, that figure is expected to rise to ten days per year. Three additional hot days may sound modest, but each additional day extends the duration of heat exposure, reduces recovery time for vulnerable individuals, and increases the likelihood that a heat event coincides with other stressors such as power outages or bushfire smoke.
Mapping Risk to Target Action
The value of the Hobart report lies in its granularity. City-wide average temperatures obscure the fact that heat risk is produced at the intersection of housing quality, canopy cover, age, income, and health status. By identifying specific suburbs and the proportion of homes in high-risk categories, the mapping allows intervention to be targeted: tree planting in low-canopy streets, retrofitting programs for older housing, cooling centres in accessible locations, and outreach to residents with chronic illness or disability.
City of Hobart Lord Mayor Anna Reynolds framed the response around both infrastructure and education: increasing tree canopy cover, using building materials that cool homes, and helping residents understand how to protect themselves and their neighbours. These are not abstract climate policies. They are practical heat-health interventions delivered at the scale where vulnerability actually exists.
The National Lesson From a Local Case
Hobart’s experience carries a broader implication for Australia. Heat adaptation is often discussed as a national or state responsibility, but the conditions that produce heat illness—poor housing, low canopy, social isolation, chronic disease—are intensely local. A city that assumes it is too cool for heat risk will underinvest in warning systems, building standards, and community outreach. The 2026 Hobart data shows what happens when that assumption meets a changing climate: the risk does not disappear. It simply goes unmapped until the ambulance dispatches and mortality records begin to rise.